TikZ in LaTeX (1) 起步
-
0 简介
TikZ是LaTeX绘图框架PGF(“画手”)的“设计师”。PGF提供了绘图引擎、数学引擎、对象设计引擎(key机制)等,但是语法较为繁杂。TikZ是德语 TikZ ist kein Zeichenprogramm 的首字母缩写,意思是 TikZ不是一个绘图程序,但是实际上TikZ可以绘制绝大多数图形(文档有 1318 页,是我看过最长的文档)。比较有特色的就是流程图、电路图(更全面的可以使用基于TikZ开发的Circuitikz库)、几何证明用图、函数图像(含三维)、脑图等等。

看起来精美,学起来也并不复杂,掌握了基本的语法之后每个人都可以在
LaTeX中画出自己想要的图像。此贴中为模板的汇总,不同的功能将在各个帖子中记录。在未特别说明的情况下,
LaTeX使用XeLaTeX引擎渲染,TikZ版本为3.1.5。部分功能需要安装gnuplot软件。1 Snippet
这里是模板汇总
0) 起步
导入
\usepackage{tikz}
\usepackage{pgf} % optional
\usetikzlibrary{calc, graphs, shapes, ...} % require libraries
环境
\begin{tikzpicture}[<options>]
 % 绘图内容
\end{tikzpicture}
当然也可以作为浮动元素
\begin{figure}[htb!]
    \begin{tikzpicture}[scale=1]
     % 绘图内容
    \end{tikzpicture}
    \caption{<caption>}
    \label{<label>}
\end{figure}
1) 点
\coordinate (<id>) at (<x>, <y>); % name a point
\node (<id>) at (<x>, <y>) [<options>] {<text>}; % place a node with text
Example
\begin{tikzpicture}[] \node (N) [font=\tiny] at (0,0) {}; \node [red] at ([xshift=0.5cm] N) { }; \node [blue] at (3, 0) {Oh you can really dance!}; \end{tikzpicture} 
2) Draw / Path
1 Basic
\path ... <coordinate> ...; % Move To
\path ... -- <coordinate or cycle> ...; % StraightLines
\path ... -| <coordinate or cycle> ...; % Horizontal and Vertical Lines, or |-
\path ... foreach <variables>[<options>] in {<path commands>} ...; % Foreach
而
\draw可以看作\path[draw]语句。此外还有弧、贝塞尔曲线、矩形、圆角折线、圆(椭圆)、正余弦、网格等。Example
\begin{tikzpicture}[]
    \draw[help lines] (-2, -2) grid (2, 2); % Grids
    \draw[thick] (-2, -2) -- (-1.5, -1.5) -| (-1, 0) to (0, -1); % Lines
    \path[draw, purple] (0, -1) .. controls (0.1, 0) and (0.7, -0.5) .. (1.5, 1.5); % Bezier curve
\end{tikzpicture}
2 Line Width Options
设置线宽。
/tikz/line width = <dimension> % initally 0.4pt, no defaultDisplay
\begin{tikzpicture}[]
    \foreach \y/\s/\w in {
        0/ultra thin/0.1pt, .2/very thin/0.2pt,
        .4/thin/0.4pt, .6/semithick/0.6pt,
        .8/thick/0.8pt, 1/very thick/1.2pt,
        1.2/ultra thick/1.6pt
    }
    {
        \draw[\s] (0, \y) -- ++(1, 0) node[right, font=\tiny] {\s};
        \node[font=\tiny] at (2.7, \y) {\textsf{\w}};
    };
\end{tikzpicture}
-
3 Specifying a Color
Tikz库使用 xcolor 库解析色彩,颜色定义的语法需参考xcolor库,下文中仅简要介绍。Tikz中通过设置color键值(有多种模式)指定画笔颜色。/tikz/color = <color name> % (no default)xcolor中指定了如下基本颜色,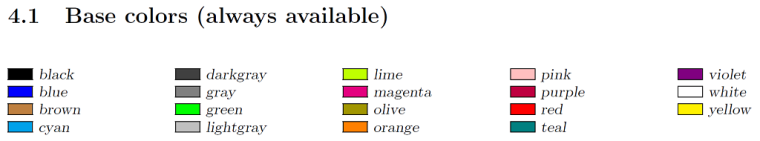
以下代码将文本设定为橙色,圆的边(draw)为红色且填充(fill)为水蓝。
\begin{tikzpicture}
    \node[orange] at (0, 0) {Text};
    \path[ultra thick, draw=yellow, fill=teal] (1, 0) circle (10pt);
\end{tikzpicture}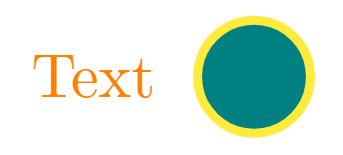
色彩空间 关键词 示例 灰度 gray/Gray \definecolor{gray_light}{gray}{0.33}RGB rgb/RGB \definecolor{amber}{rgb}{1.0, 0.75, 0.0}RGB HTML \definecolor{mega}{html}{E91E63}HSB hsb/HSB \definecolor{mega}{hsb}{0.9, 0.82, 0.52}Alpha a!x!b red!50!limeDisplay
\begin{tikzpicture}

    \node[left, font=\small] at (-.5, .5) { \textsf{X} };
    \node[left, font=\small] at (-.3, 0) { \textsf{\\definecolor\{\}\{gray\}\{X\}} };
    \node[left, font=\small] at (-.3, -.5) { \textsf{\\definecolor\{\}\{rgb\}\{X,1,1\}} };
    \node[left, font=\small] at (-.3, -1) { \textsf{\\definecolor\{\}\{rgb\}\{X,0,0\}} };
    \node[left, font=\small] at (-.3, -1.5) { \textsf{\\definecolor\{\}\{rgb\}\{0,X,0\}} };
    \node[left, font=\small] at (-.3, -2) { \textsf{\\definecolor\{\}\{rgb\}\{0,0,X\}} };
    \node[left, font=\small] at (-.3, -2.5) { \textsf{red!100X} };
    \node[left, font=\small] at (-.3, -3) { \textsf{red!100X!lime} };

    \foreach \y in {0, ..., 10} {
        \pgfmathsetmacro{\gr}{\y/10}
        \pgfmathsetmacro{\gh}{\y*10}
        \node[font=\small] at (.6 * \y + .25, .5) {\pgfmathprintnumber[fixed, precision=2]{\gr}};

        \definecolor{gray_\y}{gray}{\gr}
        \definecolor{rgb_r_\y}{rgb}{\gr,0,0}
        \definecolor{rgb_R_\y}{rgb}{\gr,1,1}
        \definecolor{rgb_g_\y}{rgb}{0,\gr,0}
        \definecolor{rgb_b_\y}{rgb}{0,0,\gr}

        \draw[fill=gray_\y] (.6 * \y, -.15) rectangle +(.5, .3);
        \draw[fill=rgb_R_\y] (.6 * \y, -.65) rectangle +(.5, .3);
        \draw[fill=rgb_r_\y] (.6 * \y, -1.15) rectangle +(.5, .3);
        \draw[fill=rgb_g_\y] (.6 * \y, -1.65) rectangle +(.5, .3);
        \draw[fill=rgb_b_\y] (.6 * \y, -2.15) rectangle +(.5, .3);
        \draw[fill=red!\gh] (.6 * \y, -2.65) rectangle +(.5, .3);
        \draw[fill=red!\gh!lime] (.6 * \y, -3.15) rectangle +(.5, .3);
    }
\end{tikzpicture}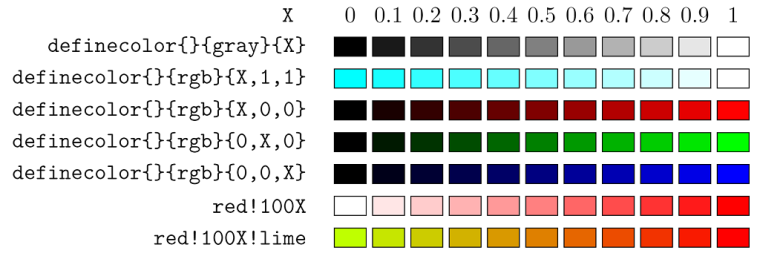
-
3) 箭头 Arrow
Tikz框架中,几乎任何非clip的闭合path都可以放置箭头。由于箭头十分常用,Tikz中箭头不需要指定键名(arrow或tips)就能使用,其基本的规则为,/tikz/arrows=<start arrow spec>-<end arrow spec> % (no default)Display
\begin{tikzpicture}
    \node[font=\small] at (0, .5) {\textbf{Barbed Arrow}};
    \foreach \y/\t in {
        0/Arc Barb, 1/Bar, 2/Bracket, 3/Hooks,
        4/Parenthesis, 5/Straight Barb, 6/Tee Barb
    }{
        \node[left, font=\small] at (-.3, -.4 * \y) { \t };
        \draw[{\t}-{\t}] (0, -.4 * \y) -- ++(1, 0);
    }

    \node[font=\small] at (3.6, .5) {\textbf{Geometric Arrow}};
    \foreach \y/\t in {
        0/Circle, 1/Diamond, 2/Ellipse, 3/Kite, 4/Latex,
        5/Rectangle, 6/Square, 7/Stealth, 8/Triangle, 9/Turned Square
    }{
        \node[left, font=\small] at (3.7, -.4 * \y) { \t };
        \draw[{\t}-{\t}] (4, -.4 * \y) -- ++(1, 0);
    }
    \foreach \y/\t in {10/Latex, 11/Stealth}{
        \node[left, font=\small] at (3.7, -.4 * \y) { \t[round] };
        \draw[{\t[round]}-{\t[round]}] (4, -.4 * \y) -- ++(1, 0);
    }

    \node[font=\small] at (8.6, .5) {\textbf{Geometric Arrow(Open)}};
    \foreach \y/\t in {
        0/Circle, 1/Diamond, 2/Ellipse, 3/Kite, 4/Latex,
        5/Rectangle, 6/Square, 7/Stealth, 8/Triangle, 9/Turned Square
    }{
        \node[left, font=\small] at (8.7, -.4 * \y) { \t[open] };
        \draw[{\t[open]}-{\t[open]}] (9, -.4 * \y) -- ++(1, 0);
    }
    \foreach \y/\t in {10/Latex, 11/Stealth}{
        \node[left, font=\small] at (8.7, -.4 * \y) { \t[round, open] };
        \draw[{\t[round, open]}-{\t[round, open]}] (9, -.4 * \y) -- ++(1, 0);
    }
\end{tikzpicture}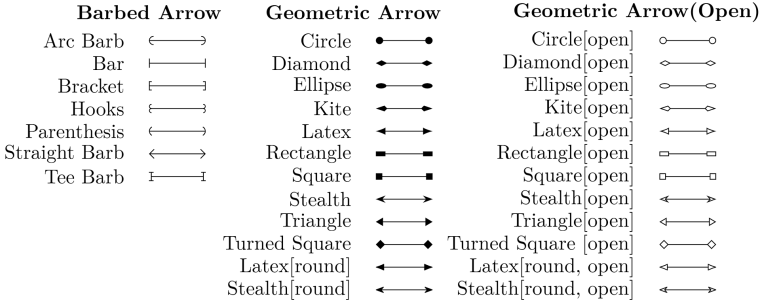
为了简便,可以使用
< > | * o .等简写箭头(简写表格待补充)。当然也可以指定多级箭头。例如\begin{tikzpicture}[scale=2, ultra thick] \begin{scope}[>=Latex] \draw[>->] (0pt,3ex) -- (1cm,3ex); \draw[|<->>|] (0pt,2ex) -- (1cm,2ex); \end{scope} \begin{scope}[>=Stealth] \draw[>->] (0pt,1ex) -- (1cm,1ex); \draw[|<<.<->|] (0pt,0ex) -- (1cm,0ex); \end{scope} \end{tikzpicture}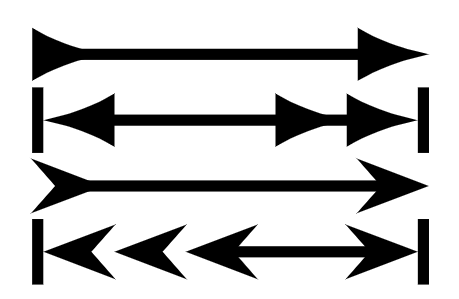
此外,箭头也可以设置宽度、拉伸等样式,其完整的功能过多,此处不赘述。